Dashboards Don’t Run Data Platforms
Modern data platforms have never been better instrumented.
Open almost any enterprise environment today and you’ll find a familiar collection of tools:
- Grafana
- Datadog
- Airflow
- Snowflake dashboards
- dbt documentation
- Cloud monitoring
- Data catalogs
- Lineage platforms
Individually, each of these products does exactly what it was designed to do. Together, they provide more metrics, alerts, logs, and visualizations than ever before.
So why do data teams still spend hours diagnosing a failed pipeline?
The dashboard explosion
Over the past decade, we’ve become exceptionally good at measuring everything.
- Infrastructure dashboards tell us CPU, memory, and network utilization.
- Orchestration dashboards show running, queued, and failed jobs.
- Warehouse dashboards expose query performance and warehouse utilization.
- Transformation tools document models and dependencies.
- Observability platforms detect anomalies in data quality.
Every layer of the platform has its own window into reality.
The problem is that reality isn’t divided into layers.
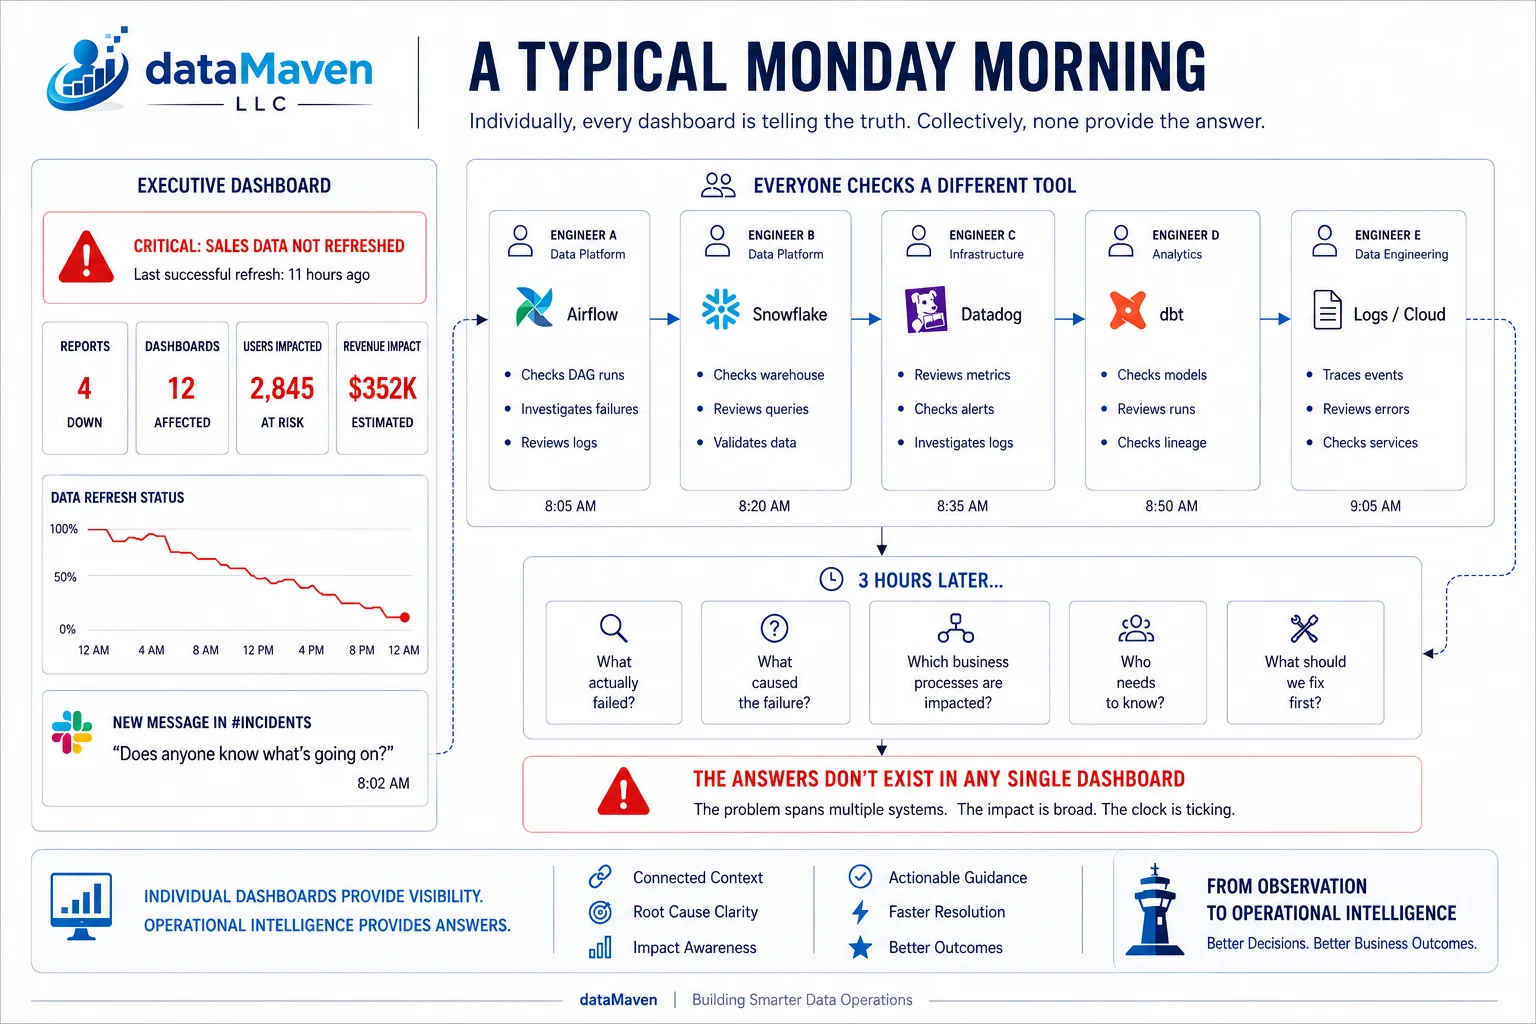
A typical Monday morning
A critical dashboard hasn’t refreshed. Executives are waiting. The first Slack message appears:
What follows is a familiar pattern.
- Someone checks Airflow.
- Another investigates Snowflake.
- Someone else reviews infrastructure metrics.
- The analytics engineer opens dbt.
- An engineer starts tracing logs.
Individually, every dashboard is telling the truth. Collectively, none of them answer the most important questions:
- What actually failed?
- What caused the failure?
- Which business processes are impacted?
- Who needs to know?
- What should we fix first?
The answers don’t exist in any single dashboard because the problem spans multiple systems.
Visibility isn’t understanding
Most monitoring tools answer what happened. Few explain why it happened. Even fewer identify what happens next.
A failed ingestion job might be caused by:
- A delayed upstream replication process
- An expired service credential
- A schema change
- A cloud networking issue
- A failed infrastructure deployment
By the time the failure appears in a dashboard, the actual cause may have occurred hours earlier in a completely different system.
The challenge isn’t a lack of monitoring. It’s a lack of operational context.
The missing layer
Today’s enterprise data platforms resemble modern cities. We have traffic cameras, weather stations, road sensors, emergency services, and GPS systems. What we often lack is a central control room that understands how all those signals relate to one another.
Enterprise data platforms are no different. We’ve invested heavily in collecting telemetry. We’ve invested far less in connecting it.
What data teams increasingly need isn’t another dashboard. They need an operational intelligence layer that understands relationships between systems, events, pipelines, metadata, business processes, and downstream impact.
Not another screen. A system that answers:
Looking beyond dashboards
Dashboards remain essential. They provide visibility into individual systems and help teams understand the health of specific components.
But modern data platforms have grown beyond the point where individual dashboards can explain platform behavior.
As organizations adopt more cloud services, more orchestration tools, more AI workloads, and increasingly distributed architectures, operational complexity grows faster than our ability to manage it.
The next generation of enterprise data operations won’t be built on more dashboards. It will be built on connected operational intelligence — where relationships matter as much as metrics, and understanding matters more than observation.
The question is whether we’re giving them the information they actually need.